Adrian Arbib T/A Evolve Electric
Oxfordshire · South-East
Solar PV
View profileSolar installers · Oxfordshire
46 listed, MCS-certified installers cover Oxfordshire: 24 based here, 22 travelling in from nearby.
Listed installers
Near you
Enter your postcode, or use your location, to see which of the listed installers cover your district and what a roof there typically generates.
Oxfordshire · South-East

Oxfordshire · South-East
Trading since 2022

Stanton Harcourt · South-East



A survey is the only way to confirm what your roof can actually do. Contact whoever covers your area directly when you're ready, or leave your details below and installers covering your area will call you.
Leave your details today and installers covering your postcode will call to arrange a survey and quote. Free and no obligation.

Enter your postcode and we'll estimate your roof's direction, its solar potential, and show certified installers covering your area.
By the numbers
Typical yearly generation, per kW of panels
≈1,022 kWh per kWp a year — roughly 10% above the UK average
For every kilowatt of panels, a well-placed Oxfordshire roof generates about this much a year. Your own total depends on roof direction, pitch and shading — the roof check estimates it for your address.
How the sun falls across the year
Sunlight peaks in summer and dips in winter, so a system is sized for the whole year, not just the peak. Estimated from PVGIS climate data for your postcode area; a roof survey confirms your exact figure.
Solar resource data: © European Union, 2025, PVGIS, EU Science Hub.
46 MCS-certified installers cover Oxfordshire in our directory, and 21 also fit battery storage and 7 also install heat pumps.
Sun figures from PVGIS; roof estimates include solar data from Google. How we measure.
Wider area
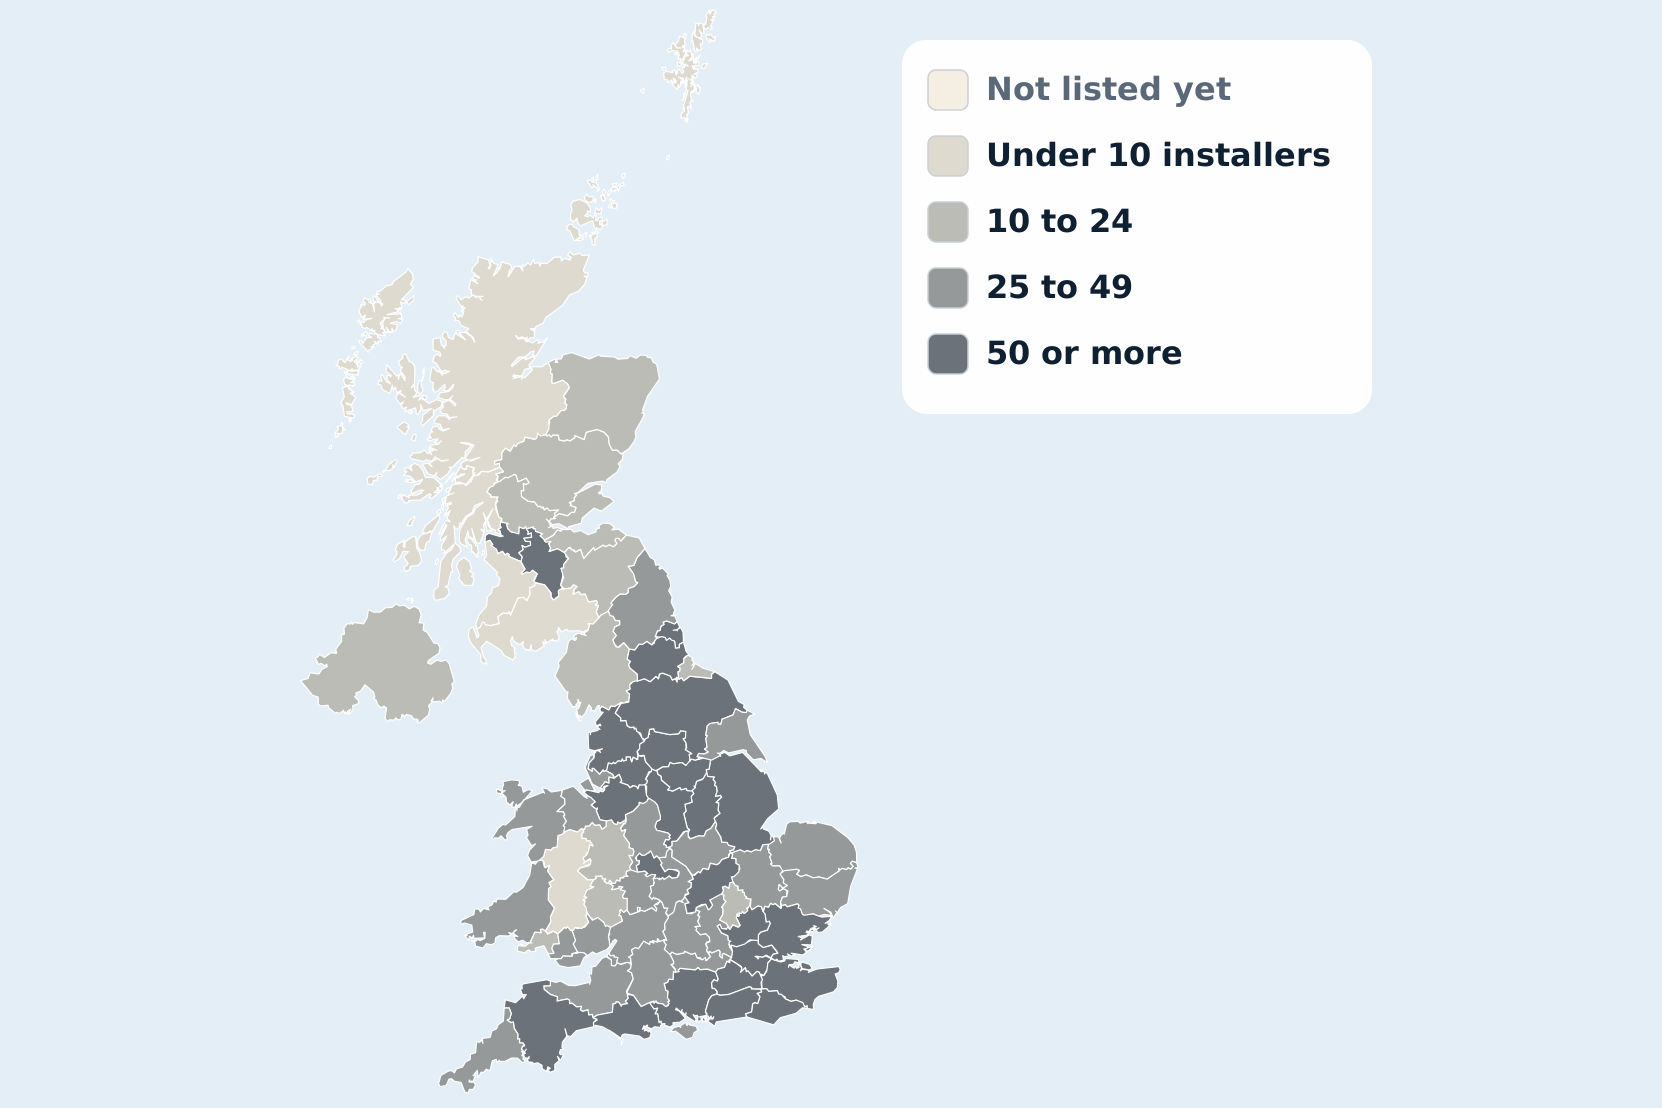
Oxfordshire is one county in South-East England. The region page lists every city we cover there, and the national map shows listed installers county by county.
Claim your free profile if we've already listed you, or add your company to the directory.