
Is your roof Solar-able?
See your roof from above, which way it faces, and what solar could save you. About a minute, no account.
How it works
Three steps, no sign-up.
- 1
Enter your address
Street address and ZIP code. That's all we need.
- 2
We read your roof
Aerial imagery and Google's roof model pick out each roof face, its pitch and the usable area.
- 3
Your Solarable Report
A score for your roof, panel count, kWh a year, dollars a year and payback, all shown as honest ranges.
Your roof, your results.
From your address we combine roof size, roof pitch and sunlight exposure to give you the clearest picture we can of your roof's solar potential.
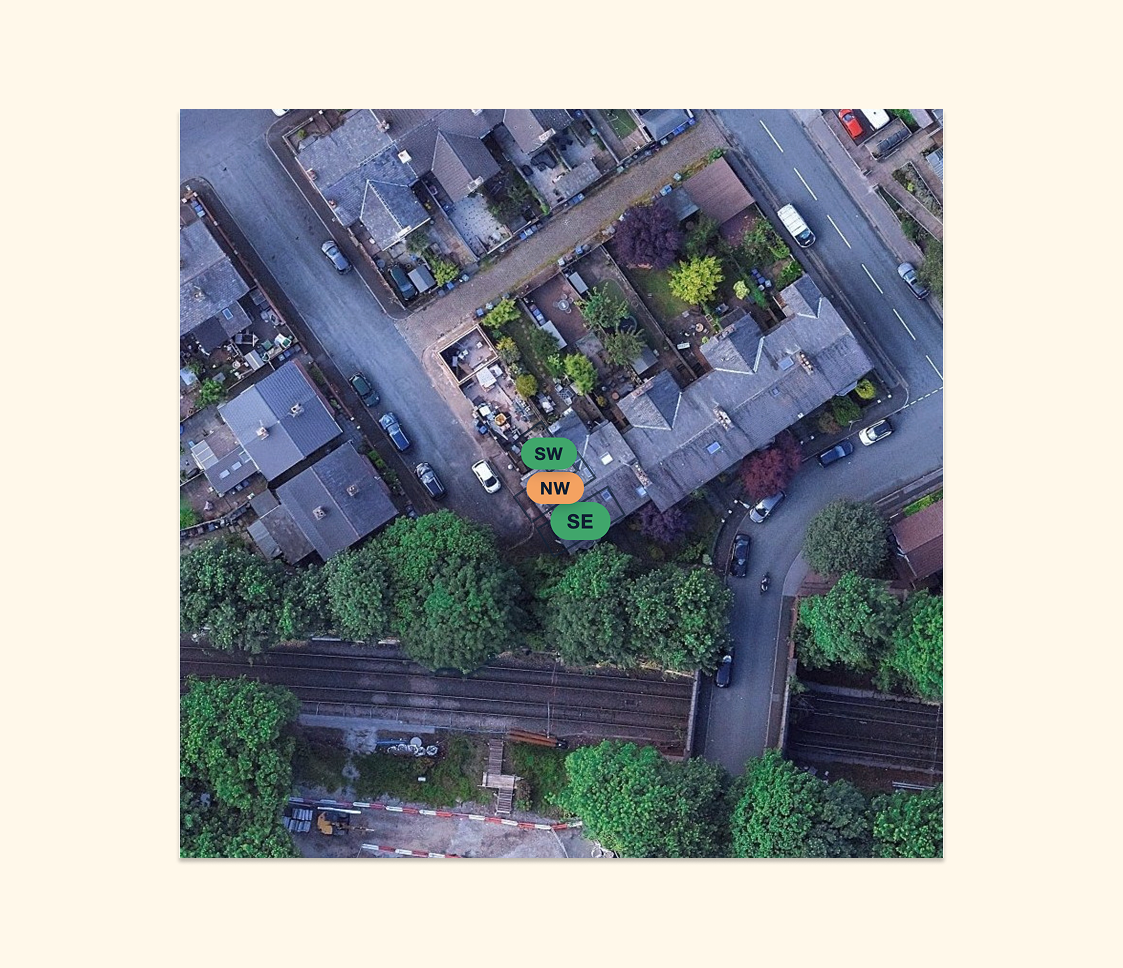
Aerial view
Your roof from above.
High-resolution imagery of your specific building.
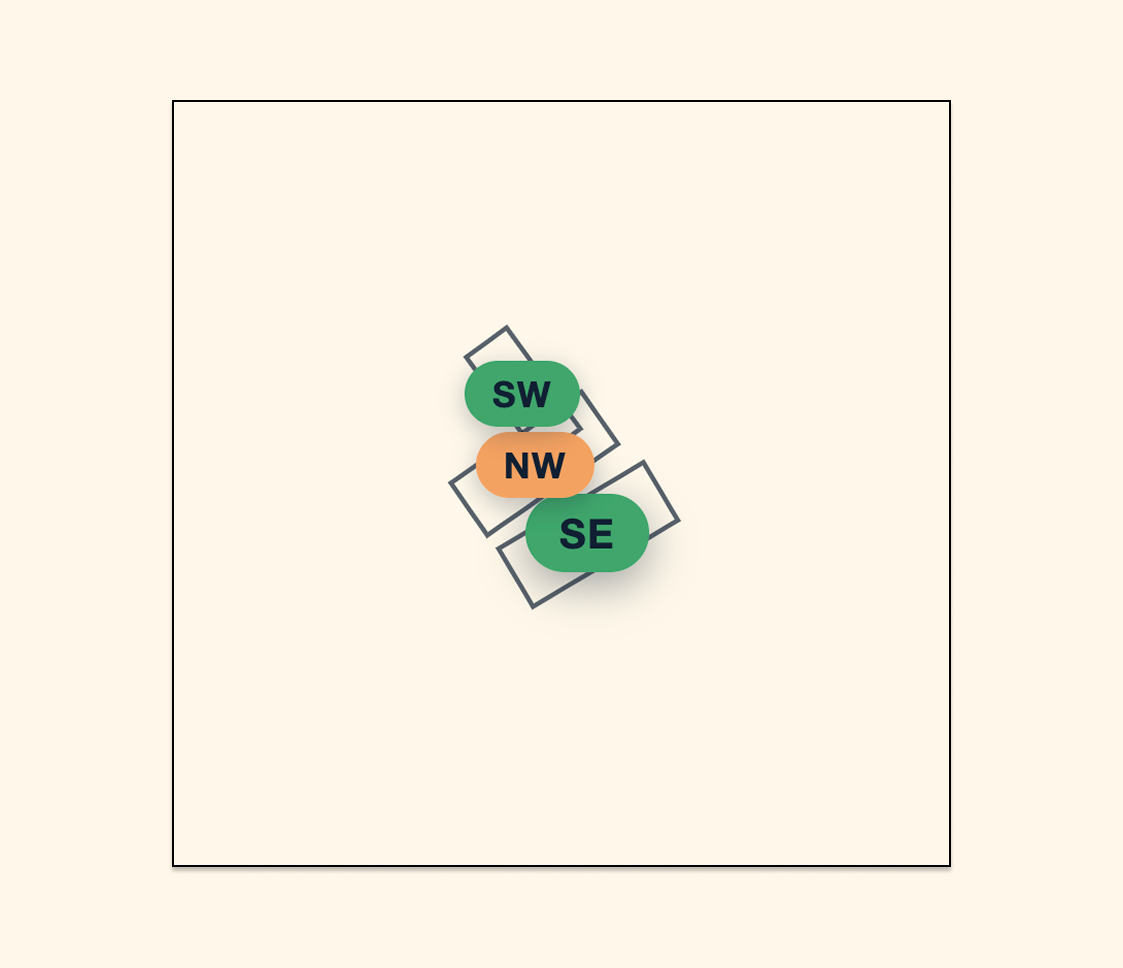
Roof orientation
Which way each face points.
Every roof face, its direction and its pitch, so you can see which one offers the best potential.
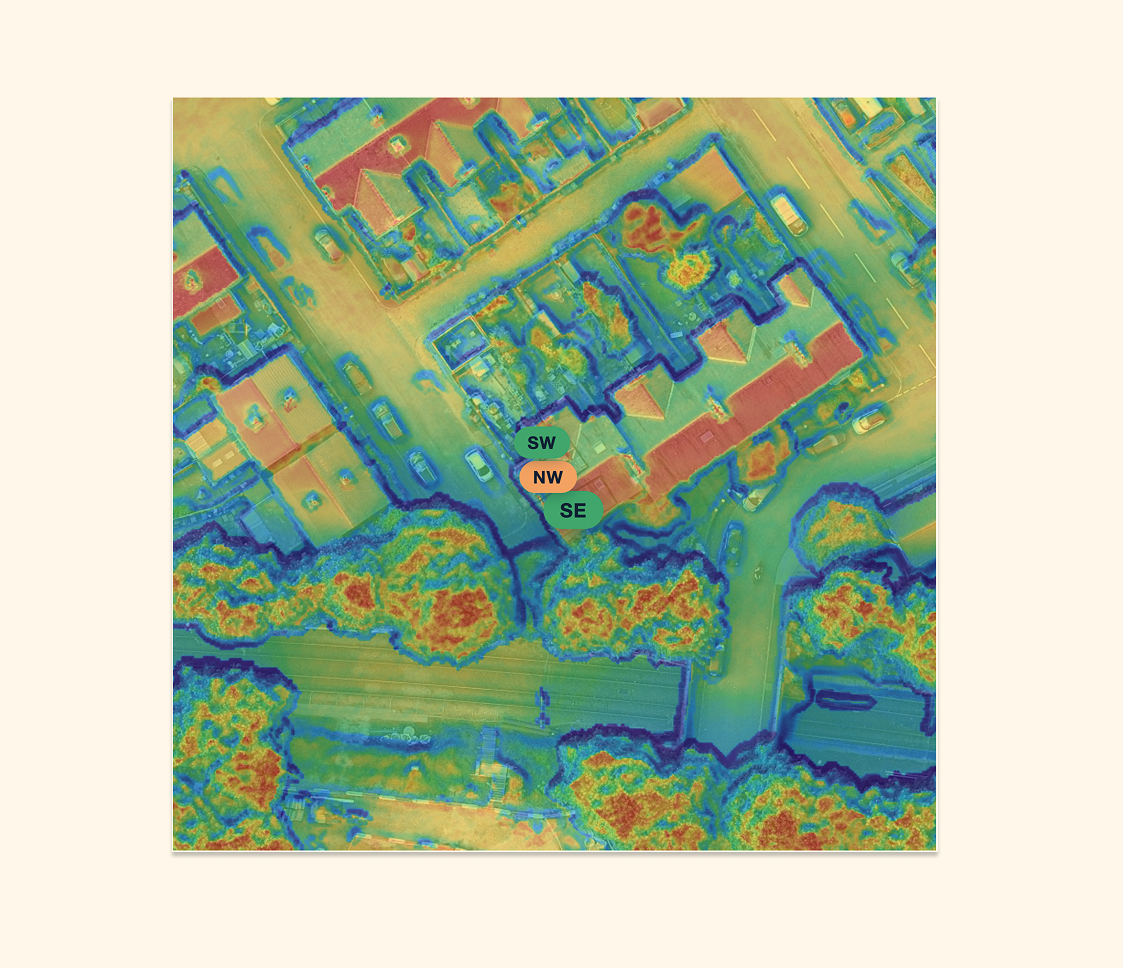
Sunlight
How much sun the roof actually gets.
See with data which parts of your roof get the most sunlight over the course of the year.


We always recommend a licensed installer's site survey to confirm shading, pitch and structure before you commit.
Coverage
More than 95% of US homes.
The roof model behind the report is Google's, built from aerial imagery across the country, so the check works for nearly any address.
Sunlight
Sun data from NREL.
Month-by-month sunlight for your location comes from the National Renewable Energy Laboratory's PVWatts, the same source installers use to size a system.
Dollars
Dollars, not guesses.
Savings use the US average electricity price and 2026 installed costs of $2.60 to $3.60 per watt, always shown as a range.
Installers
Licensed US installers, coming soon.
Every installer in the US directory will hold an active state contractor licence, with NABCEP certification shown where held. You contact them directly, on your terms. Leave your ZIP and we'll tell you when installers near you are listed.
Questions
Before you check.
Which states do you cover?
All of them. The roof check runs on Google aerial imagery that covers more than 95% of US homes, and the sun data comes from NREL, which covers the whole country. If your home is in the small gap, the report says so and lets you set the roof direction yourself.
Is the 30% federal tax credit included?
No. The residential credit (Section 25D) ended for systems installed after 2025, so we leave it out of every figure. Leased and power-purchase systems may still carry a credit on the provider's side, which is a question for the installer, not a number we can promise.
How accurate are the savings?
They are ranges, on purpose. We use the US average electricity price, 2026 installed costs of $2.60 to $3.60 per watt, and a conservative export credit, because what your utility pays for exported power varies by state. A licensed installer's quote and your own bill tighten the numbers.
What happens to my address?
It is used to find your roof and nothing else. Your report link carries a short code, not your address, and we only pass your details on with your say-so. If you join the waitlist, we email you when installers near your ZIP are listed, and you can unsubscribe at any time.
For installers
Are you a US solar installer?
Homeowners are checking roofs in your area today. Get notified when listings open and be first in your ZIP.