Solar roof check
Check your roof for solar.
Enter your postcode and pick your home. In about a minute you get a Solarable Report for your own roof: which way it faces, where the sun lands, how many panels fit and what they could save you.
Free. No account. Nobody phones you unless you ask for a price.

Is your roof right for solar?
Enter your postcode and we'll estimate your roof's direction, its solar potential, and show certified installers covering your area.
- Every installer is certified
What you get
Everything the report reads from your address.
Your home
Your roof, not your street.
Most solar tools stop at your postcode. Ours goes to the building. You pick your address from the list, and the report draws the outline of your home on an aerial view, so every figure after this is about your roof and nobody else's.
If we picked the wrong building, you can move it or draw the outline yourself, right on the report.

Roof faces
Which way each face points.
Few roofs are one simple slope. The report splits yours into its faces and shows which way each one appears to face, from south through east and west to north.
South is the classic answer, but east and west roofs often work well too, especially with a battery. The report shows you which faces are worth panels and which are not.

Sunlight
Where the sun actually lands.
A sunlight map lays a year of measured sun over your roof. Chimneys, dormers, trees and the house next door all show up as cooler patches, so you can see where panels earn their keep and where they would sit in shade.

Your roof in 3D
Flat, pitched, or a bit of both.
Extensions, flat-roofed bits at the back and odd angles are normal on British homes. The 3D view lets you turn your roof around and see its shape for yourself, so you know what an installer is talking about when they come to survey it.
Panels and output
How many panels fit, and what they make.
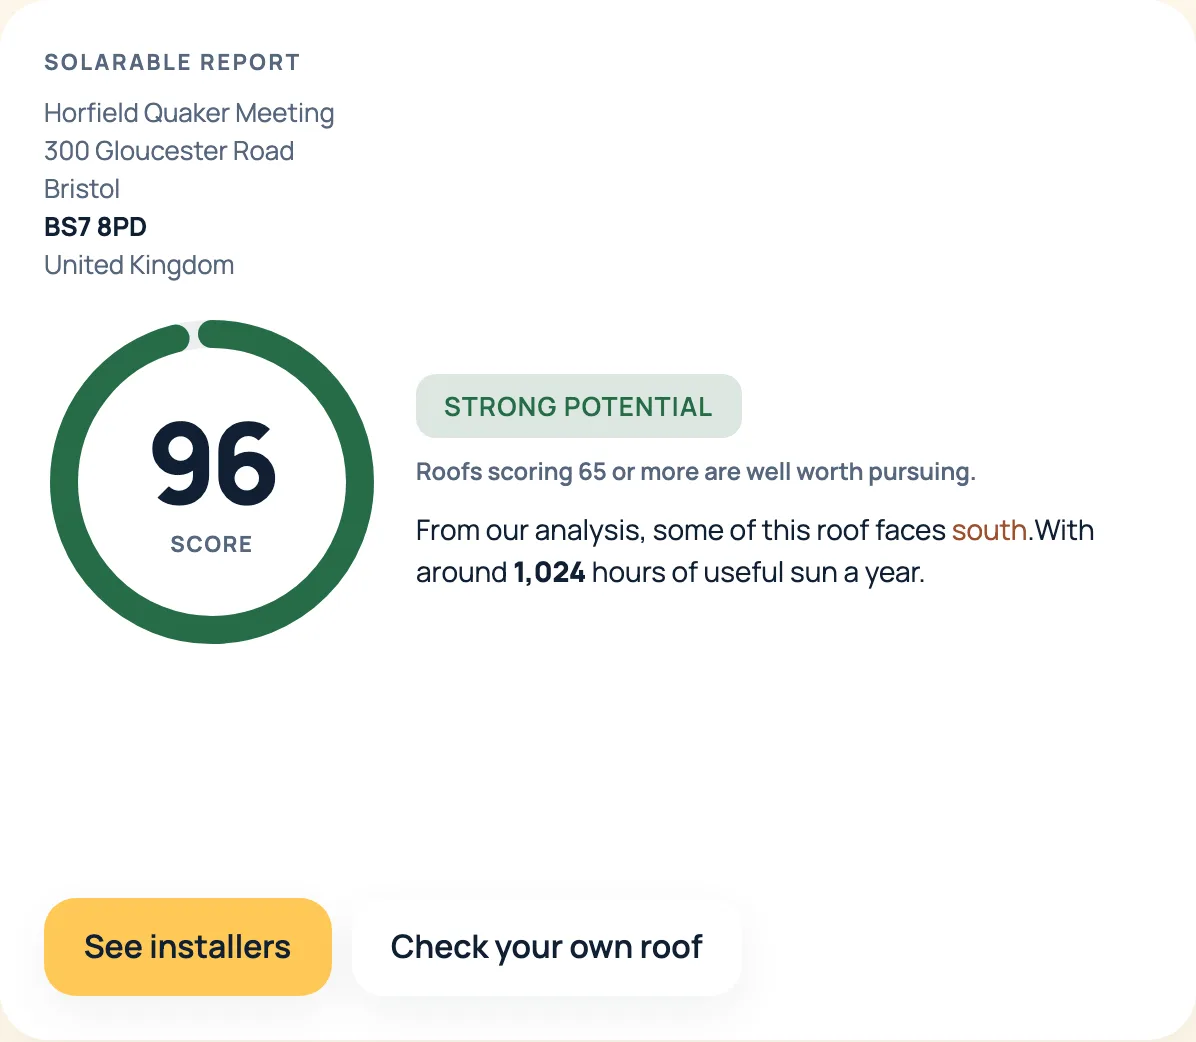
The report sizes a system to the usable parts of your roof and tells you roughly how many panels that is. Then it estimates what they would generate in a year, as a range, using the sunlight your roof gets.
Your score
One score, in plain English.
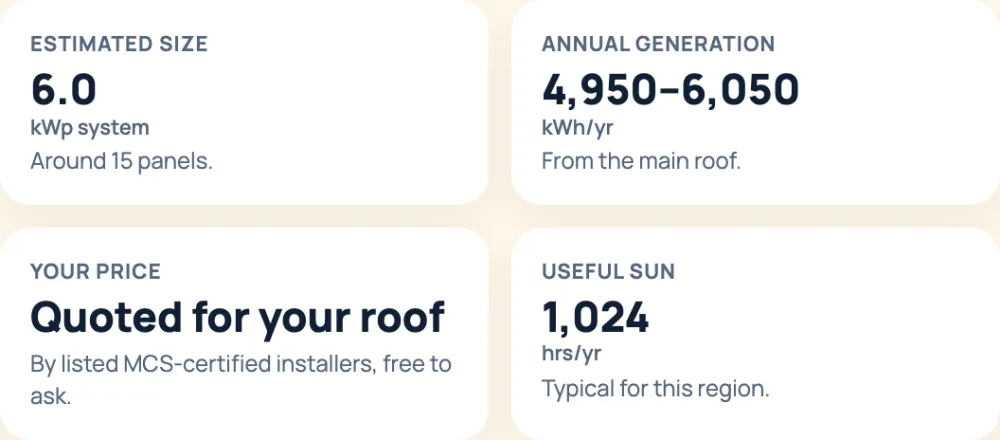
Direction, confidence and sunlight roll up into a Solarable Score out of 100 with a plain label: Strong, Good, Possible, May be difficult, or Not enough information. Roofs scoring 65 or more are well worth a survey.
Savings
What it could save, month by month.
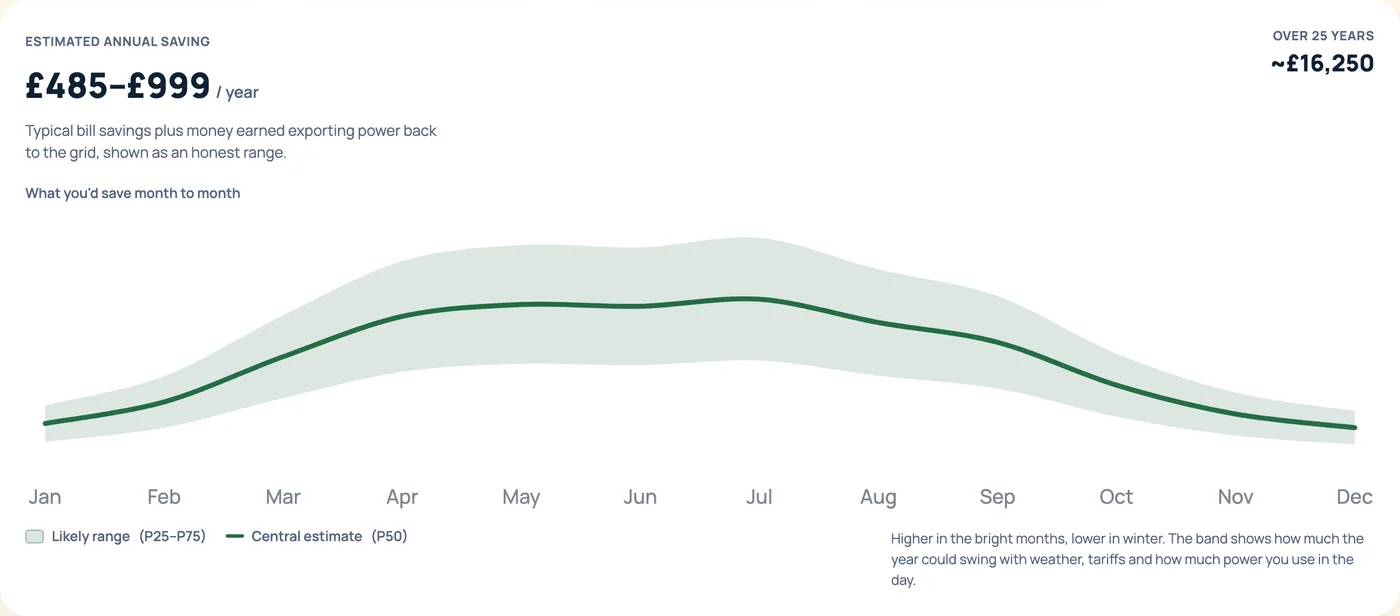
Your annual saving comes as a range: what you would stop buying from the grid plus what you would earn exporting the rest. The chart shows how it swings between a bright July and a dull December.
Want to try a battery or a different number of panels? The savings calculator picks up where the report leaves off.
Seasons
When your roof catches the sun.
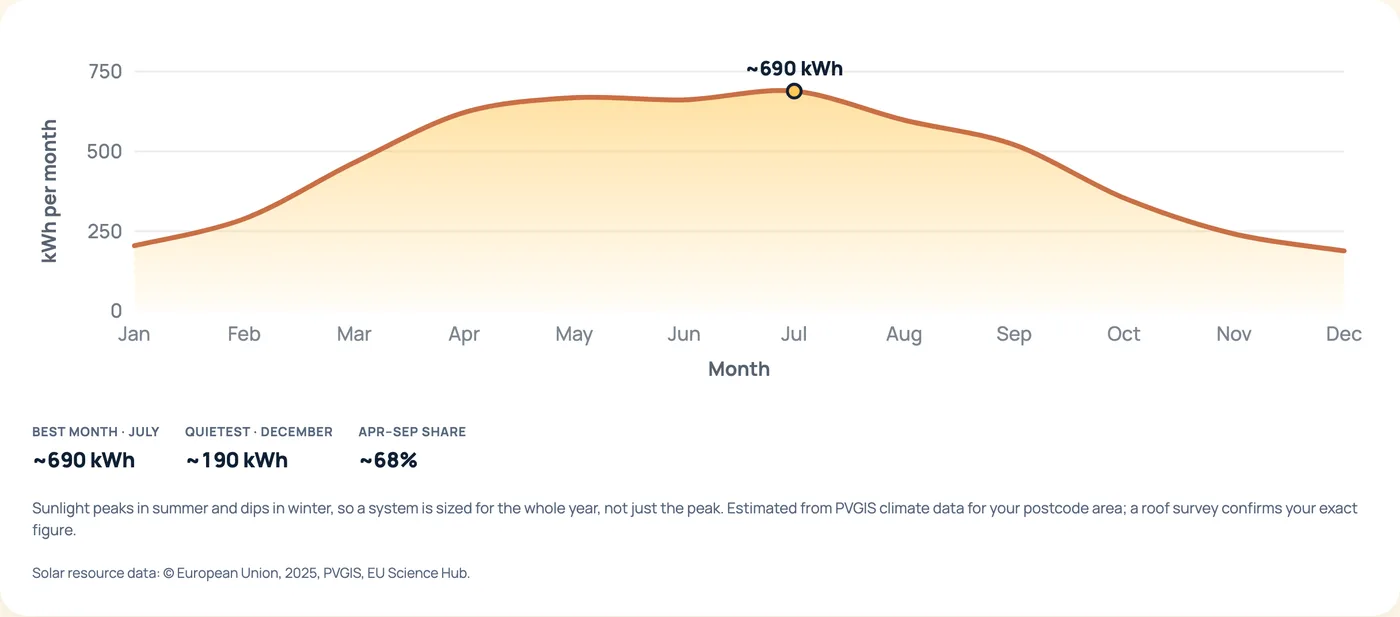
UK solar is a summer crop. The month-by-month chart shows your best month, your quietest and how much of the year's power lands between April and September, so you know what to expect in winter.
Installers
Who covers your postcode.
Under your report you see MCS-certified installers covering your postcode. Featured listings are labelled as paid placement.
When you are ready, ask for a price from your report and installers covering your area call to arrange a survey. The survey confirms shading, the roof's condition and the final design.
Want to see a whole report before you try your own? Open a real example report.
Common questions
FAQs.
Is the solar roof check free?
Yes. There is no account to create. We email you your report and a few follow-ups, and one click unsubscribes. Nobody phones you unless you ask for a price.
Will installers call me?
Only if you ask for a price from your report. Then installers covering your area call to arrange a roof survey. If you just want the report, that is where it ends.
How accurate is it?
Where measured roof data covers your home, the report reads each face of your actual roof and the sun it gets across the year. Elsewhere it works from your building outline and the sunlight in your area, and says how confident it is. Every figure is a range, and an installer survey confirms the details.
Does it work for terraced houses and bungalows?
Yes. Terraces, semis, detached homes and bungalows all read well. If you live in a flat without your own roof, the plug-in solar calculator is the better place to start.
Does the report show what solar will cost?
Your price depends on your roof, so it is quoted by installers covering your area. For typical UK costs by system size, see our guide to solar panel costs.
More on what solar costs in the UK, and plug-in solar for flats.

Your roof takes about a minute.
Check your own roof.
Enter your property number and postcode today, and we'll read your roof from the sky to get a better understanding of whether or not your roof is suitable for solar panels. Free, takes minutes, and no account necessary.


